

Functions and Recursion – 70 course points
This assignment consists of three parts. First, write a library of static methods that performs geometric transforms on polygons. Next, write a program that plots a Sierpinski triangle. Lastly, write a library os static methods to generate and analyze weather forecast.
Refer to our Programming Assignments FAQ for instructions on how to install VSCode, how to use the command line and how to submit your assignments.
Start your assignment early.
Autolab will be ready to receive submissions on Monday October 19.
Programming
Write 3 programs and submit on Autolab.
We provide this ZIP FILE containing PolygonTransform.java, and Sierpinski.java, WeatherGenerator.java. For each problem update and submit the corresponding file.
Observe the following rules:
- DO NOT use System.exit().
- DO NOT add the project or package statements.
- DO NOT change the class name.
- DO NOT change the headers of ANY of the given methods.
- DO NOT add any new class fields.
- ONLY display the result as specified by the example for each problem.
- DO NOT print other messages, follow the examples for each problem.
- USE StdIn, StdOut, StdRandom, and StdDraw libraries.
- Polygon transform (25 points). Write a library of static methods that performs various geometric transforms on polygons. Mathematically, a polygon is defined by its sequence of vertices (x0, y 0), (x 1, y 1), (x 2, y 2), …. In Java, we will represent a polygon by storing the x– and y-coordinates of the vertices in two parallel arrays x[] and y[].
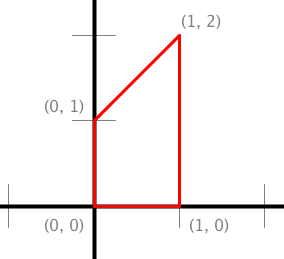
// Represents the polygon with vertices (0, 0), (1, 0), (1, 2), (0, 1).
double x[] = { 0, 1, 1, 0 };
double y[] = { 0, 0, 2, 1 };
Three useful geometric transforms are scale, translate and rotate.
- Scale the coordinates of each vertex (x i, y i) by a factor α.
- x‘i = α xi
- y‘i = α yi
- Translate each vertex (x i, y i) by a given offset (dx, dy).
- x‘i = xi + dx
- y‘i = yi + dy
- Rotate each vertex (x i, y i) by θ degrees counterclockwise, around the origin.
- x‘i = xi cos θ – yi sin θ
- y‘i = yi cos θ + xi sin θ
Write a two-dimensional transformation library by implementing the following API:
public class PolygonTransform {

   // Returns a new array object that is an exact copy of the given array.
   // The given array is not mutated.
   public static double[] copy(double[] array)

   // Scales the polygon by the factor alpha.
   public static void scale(double[] x, double[] y, double alpha)

   // Translates the polygon by (dx, dy).
   public static void translate(double[] x, double[] y, double dx, double dy)

   // Rotates the polygon theta degrees counterclockwise, about the origin.
   public static void rotate(double[] x, double[] y, double theta)

   // Tests each of the API methods by directly calling them.
   public static void main(String[] args)
}
Note that the transformation methods scale(), translate() and rotate() mutate the polygons. Here are some example test cases (tests for copy() are not shown):
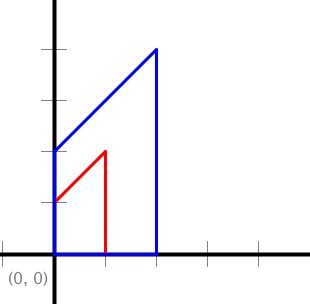
// Scales polygon by the factor 2.
StdDraw.setScale(-5.0, +5.0);
double[] x = { 0, 1, 1, 0 };
double[] y = { 0, 0, 2, 1 };
double alpha = 2.0;
StdDraw.setPenColor(StdDraw.RED);
StdDraw.polygon(x, y);
scale(x, y, alpha);
StdDraw.setPenColor(StdDraw.BLUE);
StdDraw.polygon(x, y);
// Translates polygon by (2, 1).
StdDraw.setScale(-5.0, +5.0);
double[] x = { 0, 1, 1, 0 };
double[] y = { 0, 0, 2, 1 };
double dx = 2.0, dy = 1.0;
StdDraw.setPenColor(StdDraw.RED);
StdDraw.polygon(x, y);
translate(x, y, dx, dy);
StdDraw.setPenColor(StdDraw.BLUE);
StdDraw.polygon(x, y);
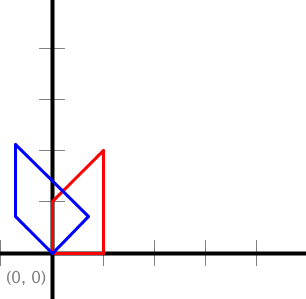
// Rotates polygon 45 degrees.
StdDraw.setScale(-5.0, +5.0);
double[] x = { 0, 1, 1, 0 };
double[] y = { 0, 0, 2, 1 };
double theta = 45.0;
StdDraw.setPenColor(StdDraw.RED);
StdDraw.polygon(x, y);
rotate(x, y, theta);
StdDraw.setPenColor(StdDraw.BLUE);
StdDraw.polygon(x, y);
- Sierpinski (10 points). The Sierpinski triangle is an example of a fractal pattern like the H-tree pattern from Section 2.3 of the textbook.


The Polish mathematician Wacław Sierpiński described the pattern in 1915, but it has appeared in Italian art since the 13th century. Though the Sierpinski triangle looks complex, it can be generated with a short recursive function. Your main task is to write a recursive function sierpinski() that plots a Sierpinski triangle of order n to standard drawing. Think recursively: sierpinski() should draw one filled equilateral triangle (pointed downwards) and then call itself recursively three times (with an appropriate stopping condition). It should draw 1 filled triangle for n = 1; 4 filled triangles for n = 2; and 13 filled triangles for n = 3; and so forth.
API specification. When writing your program, exercise modular design by organizing it into four functions, as specified in the following API:
public class Sierpinski {

   // Height of an equilateral triangle whose sides are of the specified length.
   public static double height(double length)

   // Draws a filled equilateral triangle whose bottom vertex is (x, y)
   // of the specified side length.
   public static void filledTriangle(double x, double y, double length)

   // Draws a Sierpinski triangle of order n, such that the largest filled
   // triangle has bottom vertex (x, y) and sides of the specified length.
   public static void sierpinski(int n, double x, double y, double length)

   // Takes an integer command-line argument n;
   // draws the outline of an equilateral triangle (pointed upwards) of length 1;
   // whose bottom-left vertex is (0, 0) and bottom-right vertex is (1, 0); and
   // draws a Sierpinski triangle of order n that fits snugly inside the outline.
   public static void main(String[] args)
}
Restrictions: You may not change either the scale or size of the drawing window.
This video may be helpful to understand how the triangles are drawn.
3. Weather Generator (40 points)
Overview
A weather generator produces a “synthetic” time series of weather data for a location based on
the statistical characteristics of observed weather at that location. You can think of a weather
generator as being a simulator of future weather based on observed past weather. A time series is
a collection of observations generated sequentially through time. The special feature of a time
series is that successive observations are usually expected to be dependent. In fact, this dependence
is often exploited in forecasting.
Since we are just beginning as weather forecasters, we will simplify our predictions to just
whether measurable precipitation will fall from the sky. If there is measurable precipitation,
we call it a “wet” day. Otherwise, we call it a “dry” day.
Weather Persistence
To help with understanding relationships and sequencing events through time, here’s a simple
pseudocode that shows what it means for precipitation to be persistent from one day to the next.
READ "Did it rain today?"
IF answer is yes THEN
   There is a greater chance that tomorrow will be wet rather than dry
ELSE
   There is a greater chance that tommorrow will be dry rather than wet
ENDIF
Time of year and location
| January | February | March | April | May | June | July | August | September | October | November | December |
| 0.27 | 0.33 | 0.40 | 0.46 | 0.43 | 0.28 | 0.12 | 0.17 | 0.23 | 0.21 | 0.28 | 0.27 |
| January | February | March | April | May | June | July | August | September | October | November | December |
| 0.55 | 0.58 | 0.61 | 0.69 | 0.73 | 0.62 | 0.45 | 0.55 | 0.58 | 0.55 | 0.59 | 0.55 |
READ "Did it rain today?"
IF answer is yes THEN
   READ a random value between 0 and 1
   IF the random value is less than or equal to 0.45 THEN
      No change! It is a wet day
   ELSE
      Change! It is a dry day
   ENDIF
ELSE
   READ a random value between 0 and 1
   IF the random value is less than or equal 0.12 THEN
     Change! It is a wet day
   ELSE
     No change! It is a dry day
   ENDIF
ENDIF
- predict future precipitation pattern for one month: oneMonthGenerator
- find the number of wet or dry days in a given month’s forecast: numberOfWetDryDays
- find the longest wet or dry spell in a given month’s forecast: lengthOfLongestWetDrySpell
| Longitude | Latitude | January | February | March | April | May | June | July | August | September | October | November | December |
| -97.58 | 26.02 | 0.76 | 0.75 | 0.77 | 0.74 | 0.80 | 0.86 | 0.94 | 0.97 | 0.89 | 0.77 | 0.74 | 0.77 |
public class WeatherGenerator {

    /* Given a location (longitude, latitude) in the USA and a month of the year, the method
     * returns the forecast for the month based on the drywet and wetwet transition
     * probabilities tables.
     *
     * month will be a value between 2 and 13: 2 corresponds to January, 3 corresponds to February
     * and so on. These are the column indexes of each month in the transition probabilities tables.
     *
     * The first day of the month has a 50% chance to be a wet day, 0-0.49 (wet), 0.50-0.99 (dry)
     *
     * Use StdRandom.uniform() to generate a real number uniformly in [0,1)
     */
     int[] oneMonthGenerator(double longitute, double latitude, int month, double[][] drywet, double[][] wetwet)

     // Returns the longest number of consecutive mode (WET or DRY) days in forecast.
     int numberOfWetDryDays (int[] forecast, int mode)

    /*
     * Analyzes the forecast array and returns the longest number of
     * consecutive mode (which can be WET or DRY) days in forecast.
     */
     int lengthOfLongestWetDrySpell (int[] forecast, int mode)
}
Use the main method as a driver to test your methods. To generate the weather for location at longitude -98.76 and latitude 26.70 for the month of February do:
java WeatherGenerator111 -98.76 26.70 3
public static void main (String[] args) {

        int numberOfRows    = 4001; // Total number of locations
        int numberOfColumns = 14;   // Total number of 14 columns in file
                                    // File format: longitude, latitude, 12 months of transition probabilities

        // Allocate and populate arrays that hold the transition probabilities
        double[][] drywet = new double[numberOfRows][numberOfColumns];
        double[][] wetwet = new double[numberOfRows][numberOfColumns];
        populateTransitionProbabilitiesArrays(drywet, wetwet, numberOfRows);

        /*** WRITE YOUR CODE BELLOW THIS LINE. DO NOT erase any of the lines above. ***/

        // Read command line inputs
        double longitute = Double.parseDouble(args[0]);
        double latitude  = Double.parseDouble(args[1]);
        int    month     = Integer.parseInt(args[2]);

        int[] forecast = oneMonthGenerator(longitute, latitude, month, drywet, wetwet);
        int drySpell = lengthOfLongestSpell(forecast, DRY);
        int wetSpell = lengthOfLongestSpell(forecast, WET);

        StdOut.println("There are " + forecast.length + " days in the forecast for month " + month);
        StdOut.println(drySpell + " days of dry spell.");

        for ( int i = 0; i < forecast.length; i++ ) {

            // This is the ternary operator. (conditional) ? executed if true : executed if false
            String weather = (forecast[i] == WET) ? "Wet" : "Dry";
            StdOut.println("Day " + (i+1) + " is forecasted to be " + weather);
        }
    }
Always read the main() method first, in any code. Here is a video to clarify the assignment.
Before submission
- Collaboration policy. Read our collaboration policy here.
- Update @author. Update the @author tag of the files with your name, email and netid.
- Submitting the assignment. Submit PolygonTransform.java, Sierpinski.java, andWeatherGenerator.java separately via the web submission system called Autolab. To do this, click the Assignments link from the course website; click the Submit link for that assignment.
Getting help
If anything is unclear, don’t hesitate to drop by office hours or post a question on Piazza. Find instructors office hours by clicking the Staff link from the course website. In addition to office hours we have the CAVE (Collaborative Academic Versatile Environment), a community space staffed with lab assistants which are undergraduate students further along the CS major to answer questions.
Problems 1 and 2 by Kevin Wayne and Alan Kaplan.