

Functions – 50 course points
The purpose of this assignment is to practice array manipulation, functions, passing arrays as arguments to functions, and minimal data analysis.
Refer to our Programming Assignments FAQ for instructions on how to install VScode, how to use the command line and how to submit your assignments.
Programming
The assignment has two components:
- Coding (47 points) submitted through Autolab.
- Reflection (3 points) submitted through a form.
- Submit the reflection AFTER you have completed the coding component.
- Be sure to sign in with your RU credentials! (netid@scarletmail.rutgers.edu)
- You cannot resubmit reflections but you can edit your responses before the deadline by clicking the Google Form link, signing in with their netid, and selecting “Edit your response”
We provide a zip file in Autolab containing Communities.java and input files.
Observe the following rules:
- DO NOT add any import statements
- DO NOT add the project statement
- DO NOT change the class name
- DO NOT change the headers of ANY of the given methods
- DO NOT add any new class fields
- DO NOT use System.exit()
- ONLY print the result as specified by each problem. Observe the examples’ output, display only what the problem is asking for.
- DO NOT print other messages, follow the examples for each problem.
Climate and Economic Justice
Welcome to the Climate and Economic Justice assignment!
In this assignment, you’ll be working with community data from various regions to explore the intersection of climate and economic justice. The provided data includes information about racial demographics, pollution levels, flood risks, poverty rates, and more. Your goal is to process this data using arrays and analyze the social and environmental aspects of different communities.
- Communities data analysis is an important tool to understand communities aspects. For example, flood risk and high PM2.5 levels to name a few.
- The data can help understand which communities are susceptible to flooding, or if disadvantaged communities are more susceptible to flooding than non-disadvantage communities.
Input data file and 2D array containing data
- 1 line containing an integer with the number of communities in the file, call this number n.
- n lines of communities. Each line contains 22 values with the following information about the community:
- the percentage (value between 0 and 1.0) of Black people.
- the percentage (value between 0 and 1.0) of American Indian and Alaska Native people.
- the percentage (value between 0 and 1.0) of Asian people.
- the percentage (value between 0 and 1.0) of Native Hawaiian and Pacific people.
- the percentage (value between 0 and 1.0) of people with two or more races.
- the percentage (value between 0 and 1.0) of White people.
- the percentage (value between 0 and 1.0) of Hispanic or Lantix.
- the percentage (value between 0 and 1.0) of other races not listed.
- the percentage (value between 0 and 1.0) of people under 10 years old.
- the percentage (value between 0 and 1.0) of people between 10 and 64 years old.
- the percentage (value between 0 and 1.0) of people over 64 years old.
- the total number of people in the community.
- the percentage (value between 0 and 1.0) of properties at risk of flood in 30 years.
- the percentage (value between 0 and 1.0) of properties at risk of fire in 30 years.
- the PM 2.5 level in the air.
- the number of people (18 or older) with asthma.
- the number of people (18 or older) with diabetes.
- the number of people (18 or older) with heart disease.
- life expectancy.
- the percentage (value between 0 and 1.0) of unemployment.
- contains the value 1 if the community is low income, 0 (zero) otherwise.
- contains the value 1 if the community is identified as disadvantaged, 0 (zero) otherwise.
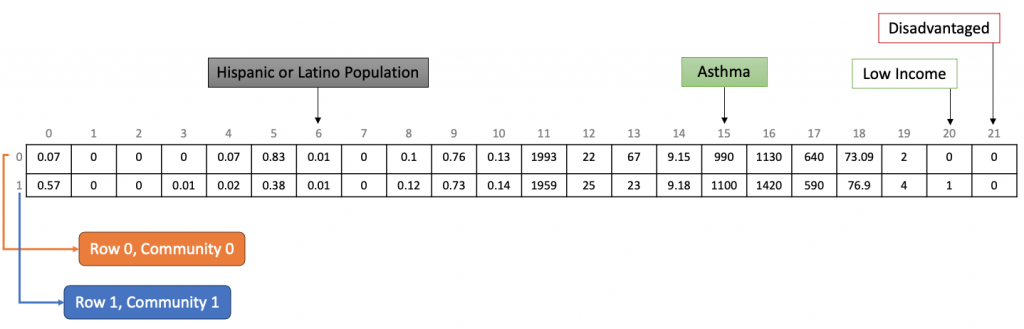
Here is an example of the file format. The sample file below contains 3 lines.
- The first line contains the number of communities (2)
- Then 2 lines. Each representing one community. The first community contains 1993 people, of which 83% are white. 990 people in this community have asthma.

- each row contains to one community.
- each column contains the values from the input file, in the order provided above.
- RD_HISP_OR_LATINO is index 6
- HLT_ASTHMA is index 15
- ECON_LOW_INCOME is index 20
- ECON_DISADVANTAGED is index 21
Functions implemented by you:
2. findAverageLifeExpectancy(double[][] data)
This function computes and returns the average life expectancy amongst all communities in the data array.
- ‘A’ asthma
- ‘D’ diabetes
- ‘H’ hearth disease
- The threshold is a number between 1 and 100. The file contains numbers between 0 and 0.100
We provide 2 input files in the zip file. CommunitiesData.csv with 64632 communities, and SampleCommunitiesData.csv with 18 communities.
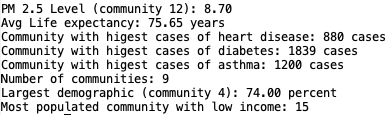
Executing the main() function with SampleCommunitiesData.csv as the input file yields.
java Communities
Before submission
Collaboration policy. Read our collaboration policy here.
Submitting the assignment. Submit Communities.java via the web submission system called Autolab. To do this, click the Assignments link from the course website; click the Submit link for that assignment.
Getting help
If anything is unclear, don’t hesitate to drop by office hours or post a question on Piazza.
- Find instructors office hours here
- Find tutors office hours in Canvas -> Tutoring, RU CATS
- Find head TAs office hours here
- POST on Piazza in Canvas -> Piazza
- In addition to office hours we have the CAVE (Collaborative Academic Versatile Environment), a community space staffed with lab assistants which are undergraduate students further along the CS major to answer questions.
Assignment by Navya Sharma and Nicole Le